← Reporting portfolioMargin Max / Financial & operating control
13-week cash forecast
See the weekly cash position and the effect of one delayed collection.
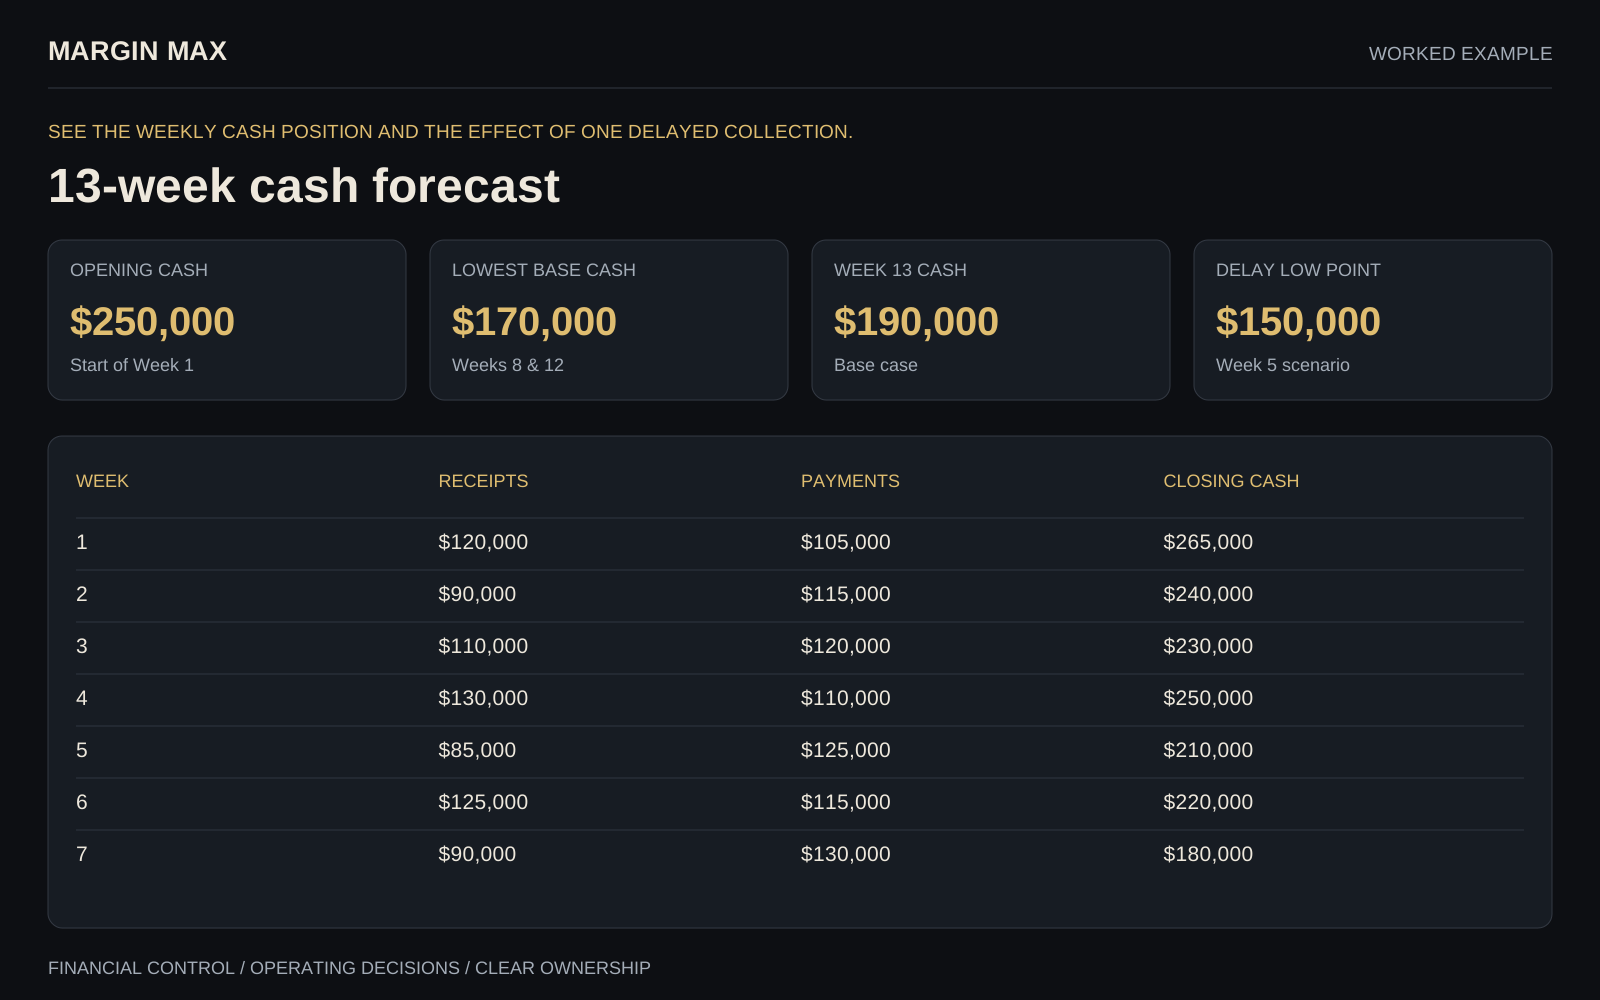
Worked example · Illustrative receipts and payments. One consistent dataset drives the tables and headline balances; the delay scenario changes timing only, with no assumed new revenue.
Delayed-collection sensitivity
Forecast assumptions
Receipts represent expected cash collection, not recognized revenue. Payments include payroll, suppliers and other operating commitments. No new borrowing, owner distributions or investment cash flows are assumed. Closing cash rolls into the following week.
Collection sensitivity
A $60,000 receipt moves from Week 4 to Week 7. Weeks 4–6 cash is therefore $60,000 below base, returning to base in Week 7. The scenario low point is $150,000 in Week 5. Assign collection ownership and update the forecast weekly.