Margin Max / Reporting & financial control
Reconciliation & system health
Compare expected balances with the records. See exceptions, reconciliation differences and workbook capacity before relying on the report.
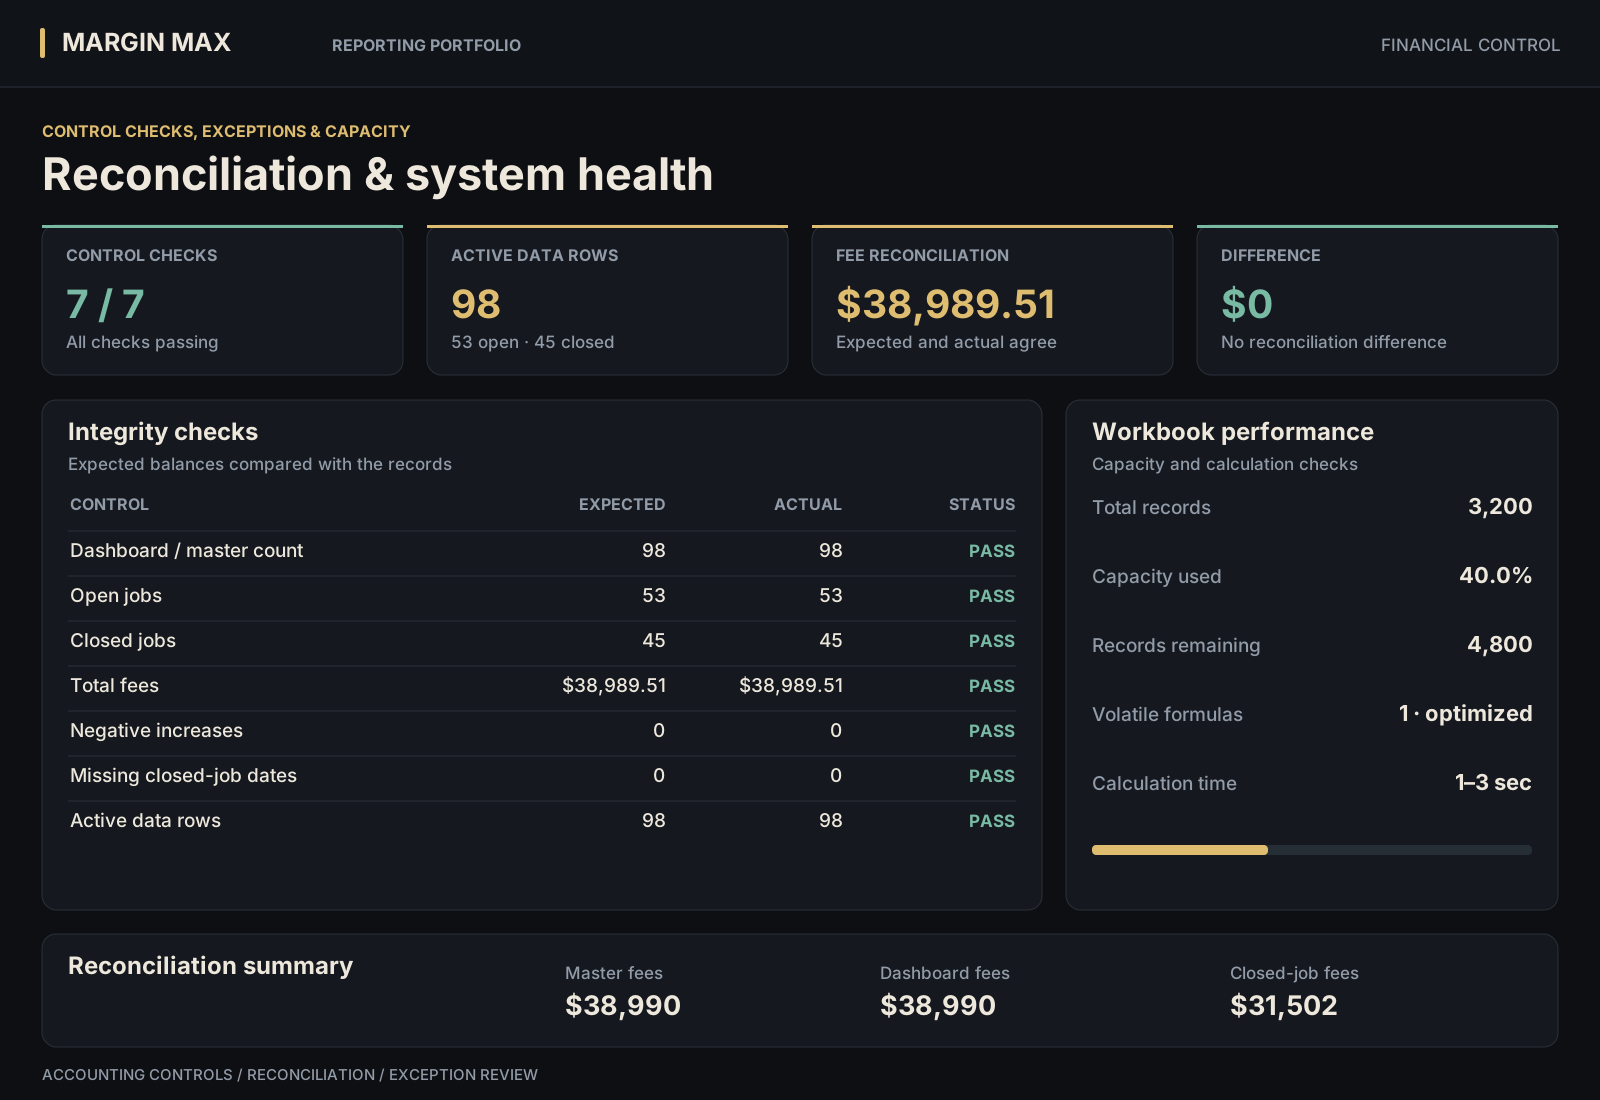
Integrity checks
| Control | Expected | Actual | Status |
|---|---|---|---|
| Dashboard total / master count | 98 | 98 | Pass |
| Open jobs count | 53 | 53 | Pass |
| Closed jobs count | 45 | 45 | Pass |
| Total fees reconciliation | $38,989.51 | $38,989.51 | Pass |
| Negative increases | 0 | 0 | Pass |
| Missing dates on closed jobs | 0 | 0 | Pass |
| Active data rows | 98 | 98 | Pass |
Workbook performance
| Measure | Value |
|---|---|
| Total records | 3200 |
| Capacity used | 40.0% |
| Records remaining | 4800 |
| Volatile formulas | 1 · optimized |
| Estimated calculation time | 1–3 seconds |
Reconciliation summary
| Measure | Value |
|---|---|
| Master fee sum | $38,990 |
| Dashboard fee display | $38,990 |
| Closed jobs fee sum | $31,502 |
| Difference | $0 |